


Digitizing a guitar string
When I bought an 8-bit Arduino Uno, my first idea was to make a guitar simulator, just for fun (and, to be honest, also to see if I still remembered those skills after so many years).
A guitar has six strings that can play at the same time, so my player needed six independent voices (hence the “play-v6” name for that music engine).
Things didn’t quite play out as I hoped (literally) so I then went on to build a more versatile synth/player.
But the original design was simpler, so I will use it as a starting point.
A digitized sound
My basic idea was to record the sound of a guitar string and to play it out at different frequencies to generate different notes, while (hopefully) retaining some of its quality.
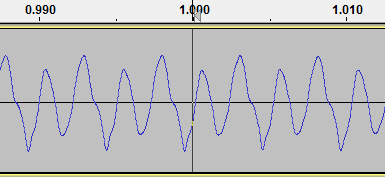
I connected a microphone to the computer, fired up Audacity and plucked a guitar string. Here is what I recorded:

What exactly does this image mean? The horizontal axis represents time (so this is a “time domain diagram”); you can see time displayed above the image, in seconds.
The vertical axis shows the electric signal (technically, the voltage) produced by the microphone; it mirrors the received sound, i.e. the pressure waves in the air created by the string vibration.
The signal has its highest amplitude (sound volume) at about 0.4 seconds, when I plucked the guitar string, then gradually fades out as the sound decreases.
Looking closer
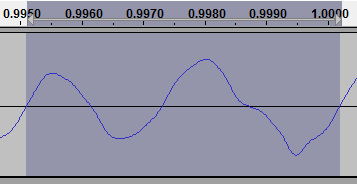
Let’s zoom in to see the same signal in more detail. This shows a much narrower time interval, a bit more than 20 milliseconds (thousandths of a second, abbreviated “ms”):
As the time labels show, this image is taken around the 1 second point in the recording (I magnified a bit the vertical axis to better show the details).
Now we can clearly see the signal shape: it reproduces the sound waves created by the oscillation of the guitar string and the resonance of the instrument body.
Notice that the signal tends to repeat itself cyclically, in this case every two peaks.
Measuring the frequency
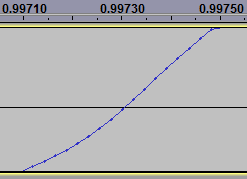
Zooming further in, this is a single cycle selected in Audacity:
I know, it looks like two distinct waves, but this is the piece of signal that repeats itself periodically, so it is in fact a single cycle of our guitar sound. Real sounds are not as simple as textbook sine waves.
How much time does this single cycle last? That’s easy to estimate; the length of our selection can be seen at the bottom of the window:
![]()
One cycle lasts approximately 0.005 seconds, that is 5 milliseconds.
(this is rather imprecise because the following digits are not shown; for a better measurement we could select 10 cycles and then divide their total length by 10).
How many of these cycles fit in one second, that is in one thousand milliseconds?
1000 ms / 5 ms = 200 cycles
Assuming that 5 ms is correct, we have 200 repetitions per second, that is 200 Hertz (abbreviated “Hz”). This is the approximate frequency of the recorded sound.
In music, the frequency of a sound is called the pitch of a note: different musical notes have different frequencies.
The note I recorded was a G (a Sol in Latin countries) from the third string; its frequency in a well-tuned guitar should be almost exactly 196 Hz, so our measurement looks fairly accurate.
Looking at the samples
Old analog tape recorders did actually record the signal as a continuously variable magnetic field, but the computer is a digital system and cannot do that: it can only store numbers.
It uses instead a device called ADC (Analog to Digital Converter) to measure the istantaneous value of the signal at regular intervals.
It’s like taking note of the room temperature every minute: you can draw a beautiful and rather accurate graph. You are losing some details, but you don’t expect the temperature to change much between a minute and the next (barring a nuclear explosion or such).
So, as long as the signal is measured frequently enough, it could be reproduced without apparent lack of quality.
Zooming in once more on both axes, Audacity shows the measured values, or samples:
Each dot represents a sample. Its value, the vertical position in the Audacity graph, is what is actually stored (as a number) in the audio file.
Samples are all we have. The dot-connecting lines are just drawn by Audacity for show.
My guitar sound was recorded at 44100 Hz (44.1 kHz), that is 44100 measurements (samples) were taken each second; this is the sampling frequency.
The task ahead
In short, all we have of the original sound is a list of numbers: the sampled values. To reproduce the sound we’ll have to take into account:
- The original frequency of the recorded note (196 Hz).
- The sampling frequency used for the recording (44100 Hz).
- The playing rate we’ll be using on the Arduino.
- The frequency of the note we want to produce. Always playing the same note would be rather boring, wouldn’t it?
It starts getting fun :-)
Next: how a PWM DAC works